Introduction to Statistics
Business Statistics is a collection of procedures and techniques used to convert data into meaningful information in a business environment.
Descriptive Statistics: Procedures and techniques designed to describe data. Involves graphical or numerical summaries. Inferential Statistics: Tools and techniques that help decision makers to draw inferences about a population parameter from a subset of data, often called a sample Population: A set which includes all measurements of interest Sample: A subset of the population Census: An enumeration of the entire set of measurements taken from the whole population Parameters: numerical measures, such as an average or a proportion, that are computed from an entire population Statistics: numerical measures, such as an average or a proportion, that are computed from a sample selected from a population
Variables and Data Types
Time-Series: set of consecutive data values observed at successive points in time (e.g. stock price. Cross-Sectional: set of data values observed at a fixed point in time (e.g. returns of the top 5 stocks in the S&P500 for the second quarter of 2017)
Levels of Data Measurement
- Qualitative (categorical) data whose measurement scale is inherently categorical (e.g. marital status, political affiliation, eye color)
- Nominal
- Ordinal
- Quantitative (numerical) measurements whose values are inherently numerical. Can be discrete (e.g. number of children) or continuous (e.g. weight, volume).
- Interval
- Ratio
- Nominal no ordering of the cases is implied, arbitrary labels Zip codes (98072); companys tax identification
- Ordinal Ranking allowed. No measurable meaning to the differences. Education level: bachelors, masters, doctorate; ranking of fortune 500
- Interval Ranking or order can be used, no true zero point Calendar year; SAT score; trade balance in dollars; profit-loss in dollars;
- Ratio the distances between consecutive numbers have meaning and the zero value represents the absence of the characteristic being studied. Ratio of two numbers is meaningful. Income, height; number of tickets sold; per capita income;
Charts and Graphs
Frequency distributions and Histograms Frequency distribution : shows the number of data observations that fall into specific intervals
Developing Frequency Distribution for Continuous Data
- Classes must be mutually exclusive. Classes do not overlap.
- Classes must be all-inclusive. A set of classes contains all possible data values.
- Classes should be of equal width, if possible. The distance between the lowest and the highest possible values in each class is equal for all classes.
- Empty classes should be avoided.
Step 1: Determine the number of classes. Step 2: Establish the class width. Step 3: Determine the class boundaries for each class. Step 4: Determine the class frequency for each class.
Number of classes:
- Rule of thumb: between 5 and 20 classes
- 2k ≥ n rule, where k is the number of classes and is defined to be the smallest integer so that 2k ≥ n, where n is the number of data values
=COUNTIF($B$3:$K$7, "<="&J24 ) - COUNTIF($B$3:$K$7, "<"&I24 )
Or Data tools and create histogram (the bin is lower than n number)
Normal, or bell shaped curve. Asymmetrical, or relatively asymmetrical (“Piles up” in the middle).
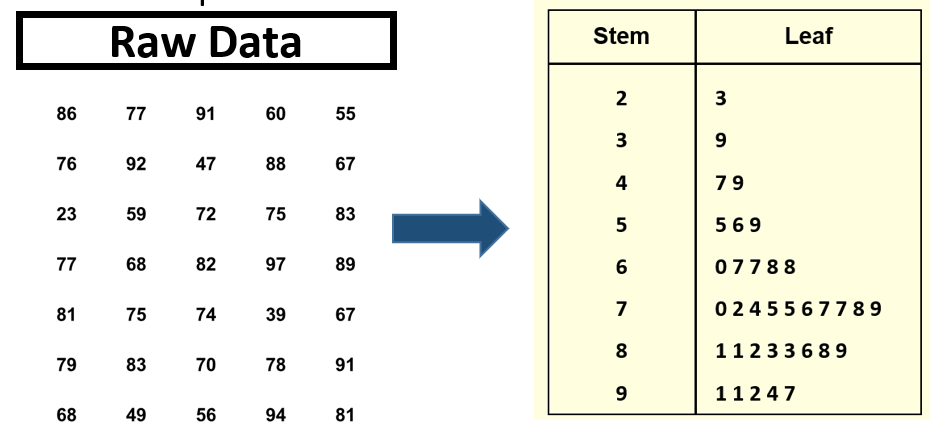
Stem-and-leaf plot Digits for each number are grouped into a stem and a leaf. Stems are the leftmost, higher values, leaves are the rightmost, lower values
Useful for observing whether values are in the upper or lower end of each bracket and seeing the spread of the values. Retains original data rather than using class midpoints to represent values.
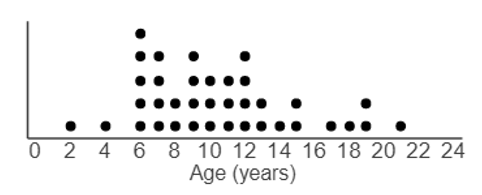
dot plot A dot plot graphs each data point, with identical values stacked vertically
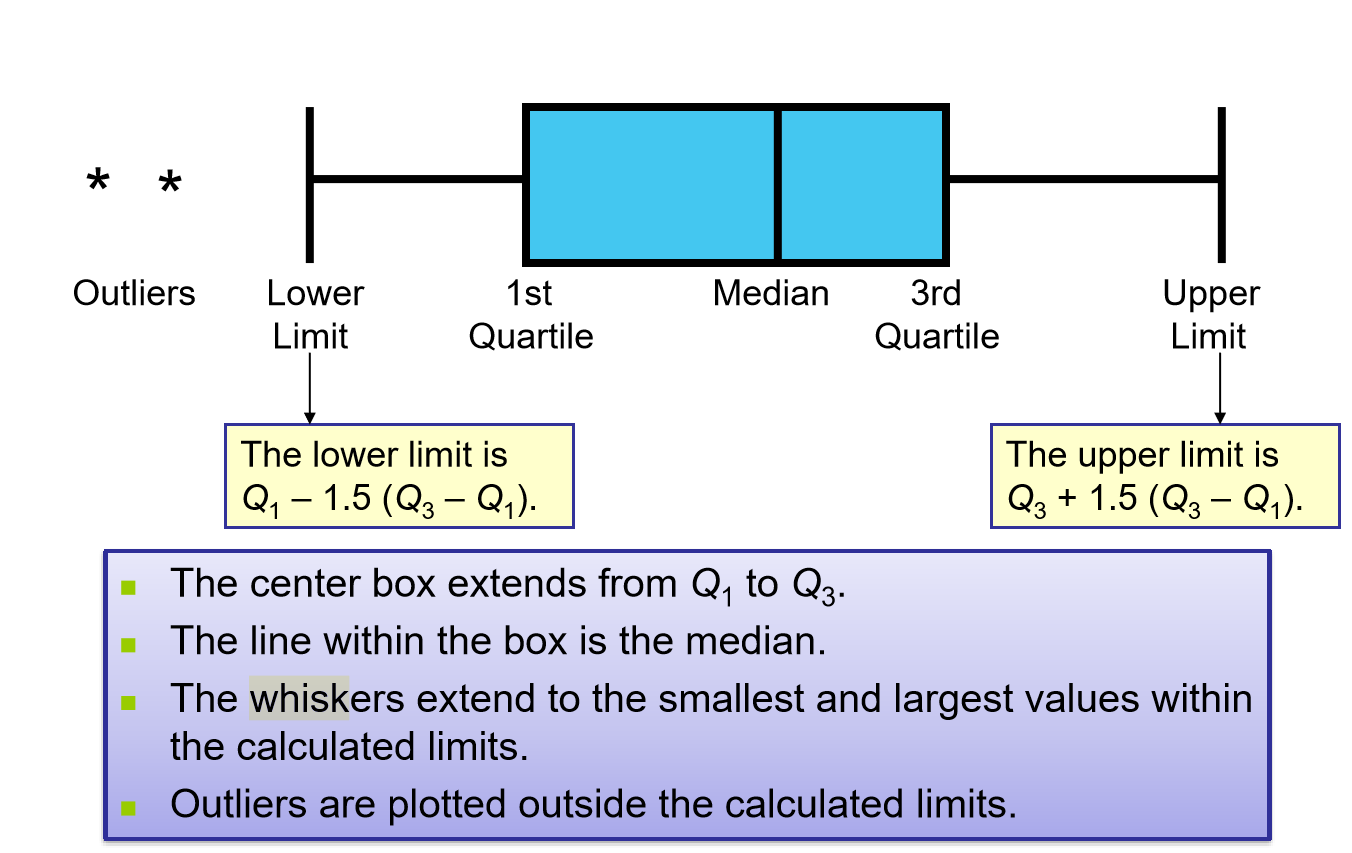
Box and Whisker Plot
Sampling Reasons for Sampling
- Time and cost effective
- For given resources, the sample can broaden the scope of the study
- If accessing the entire population is impossible, the sample is the only option
Reasons for Taking a Census
- Eliminate the possibility that a randomly selected sample may not be representative of the population.
- Generally NOT an appropriate for gathering data for statistical analysis
- To benchmark data for future studies
The US census ensures that each community gets the right number of representatives in government.
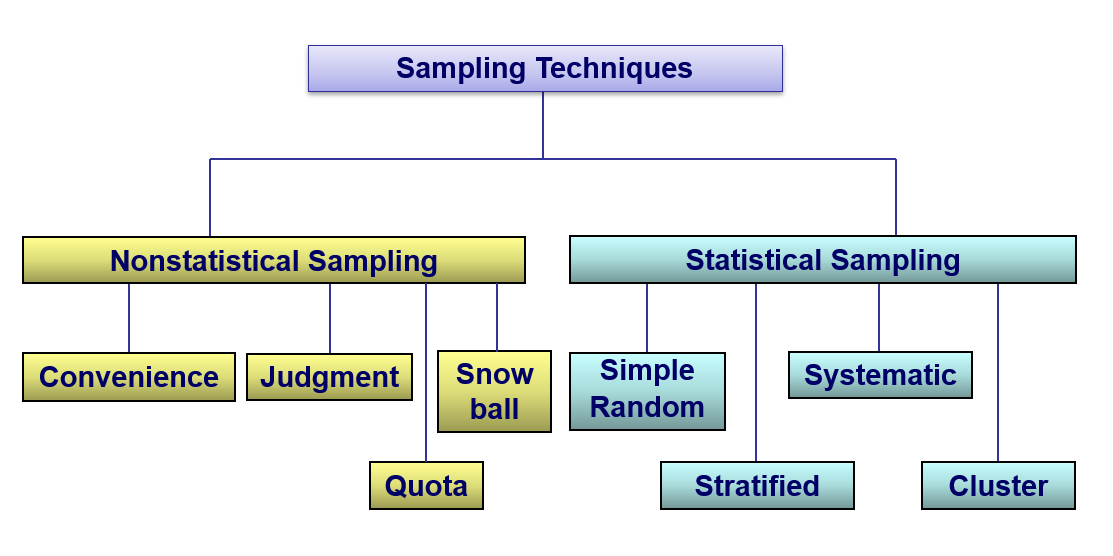
Statistical (Probability Based, or Random): use selection techniques based on chance selection Non-statistical (Nonrandom): Methods of selecting samples that use convenience, judgment, or other non-chance processes. Generally NOT appropriate for gathering data for statistical analysis
Non-statistical Sampling
Convenience Collected in the most convenient manner for the researcher. A University wishes to gather data from students to determine their interest in changing from a quarter system to a semester system. The sample is selected by stopping some students who enter the library. Judgment Based on judgments about who in the population would be most likely to provide the needed information. Can be biased due to systematic errors in judgment. An auditor uses audit software to select a random sample and employs statistical tables to evaluate the results. However, the auditor sets the sample size to 60, because that was the sample size used in the prior year.
Quota (Ratio) A sample in which the sample size selected from a given subclass (e.g., age, gender) of the population is proportional to the number of items in the population belonging to that subclass. A marketing manager is interested sampling his target population of customers. The target population contains 60% females and 30% college graduates. He will make sure that the sample contains 60% females and 30% college graduates. Graduates in exact proportions as described are then selected using convenience method.
Snowball Sampling Survey subjects are selected based on referral from other survey respondents.
Simple Random Sampling
Every possible sample of a given size has an equal chance of being selected
Stratified Random Sampling
Divide population into subgroups (called strata) according to some common characteristic; Select a simple random sample from each subgroup
Systematic Random Sampling
Decide on sample size: n Divide ordered (e.g., alphabetical) frame of N individuals into groups of k individuals: k = N / n Randomly select one individual from the 1st group Select every kth individual thereafter
Cluster Sampling
Divide population into several “clusters,” each representative of the population (e.g., county)
Sampling/Non-sampling Errors
- Sampling Error
- Occurs when the sample is not representative of the population
- Non-sampling Error (all other errors)
- Missing data
- Recording errors
- Measurement errors
- Input processing errors
- Analysis errors
- Response errors